Data Acquisition Cart

A sister lab just began operations in pressure and temperature testing, but they were still using old-fashioned chart recorders to log their data. After I showed their lab manager what the ATO Lab was capable of, he requested a mobile digital data acquisition system for his lab. I went to work creating a user-friendly data acquisition system including easy-to-use software and simple hardware connections.

DAQ Cart Labeled Photo

The resulting system can read 8 4-20 mA sensors and 6 thermocouples. In addition to the system itself, I delivered a user guide and electrical schematics.

DAQ Cart Documentation Photo

Here is the system in use on its first test:

IMG_0271

The system ended up being used for all their testing, and I built a second unit for them a couple of months later. Here is the feedback I received from the lab manager:

” I spoke with all the guys and they are happy with what they have now. I just need to get you some more equipment to build us at least another 2 carts. Appreciate all the help you have helped us with. Really do appreciate all the efforts.”

Features of the system:

  • Up to 10 Hz data logging from 8 4-20 mA channels and 6 Type J thermocouples
  • Sensor calibration information easily entered and resulting best-fit line is reviewed before committing  to system.
  • UPS battery backup to ensure power loss does not invalidate test data
  • System checks sensor calibration dates before acquiring data
  • Sensor data can be saved/loaded from file
  • System saves all testing parameters on shutdown and loads last parameters on startup

Hydraulic Wellhead Connector Cycling System

The Task

This was a project for another GE facility that was performing cyclic testing on a piece of equipment called an H4 connector. They were expecting to perform the same series of hydraulic functions over 500 times, with each complete cycle taking around 20-30 minutes. Rather than have a technician manually actuate the various functions of the connector repeatedly (as they have done in the past), I was tasked to automate the process and acquire data from pressure sensors and LVDT position sensors.

The Hardware

I went to the facility to understand the test setup and required connections. I worked with one of my instrumentation technicians to acquire the appropriate sensors while I got to work on the programming and test system wiring. I put a cRIO, data acquisition cards, power supplies, relays, and an E-stop in a Pelican case to protect against any spray from the connector’s functions. The end result I hooked into their existing test skid as shown below:

IMG_1376

The Software

The LabVIEW program I wrote included data acquisition with sensor information tracking and calibration date verification. The automated testing included safety limits at every step, and the state transitions were determined by the testing procedure. At any time, the technician could pause the system or start cycling at any step in the process. Here is the software in action with the live data feed from a few cycles:

IMG_1392

After a day of bug fixes and another day of training, the system performed well and was used to complete hundreds of cycles. The engineer on the project was pleased with the performance and gave me the following feedback:

“Thank you for all the support on the [connector] test. Your knowledge an expertise in Labview has allowed us to go from 20 cycles a day to 50 cycles a day using automation. This is a clear example of the GE Belief Learn and adapt to win by monitoring the test and making improvements along the way to help the test run smoother.”

High Speed Data Acquisition System

A high-channel-count data acquisition system I made using CompactDAQ and LabVIEW that could take 1000 Hz data from 48 channels. It was designed to be very user-friendly since many technicians on several shifts would be using it.

The Task

A GE manufacturing and assembly facility was just beginning a  factory acceptance test on a large, complex piece of equipment called a BOP stack, or blowout preventer stack. This 4-story tall piece of safety equipment has dozens of hydraulic functions, and engineers wanted to better understand how actuating one function can affect pressures in the other functions. Thus, I was asked to create a data acquisition system that could read up to  48 pressure sensors at 1000 Hz each. The system had to be waterproof to protect against exhaust from the hydraulic functions, and easy enough to use that any technician could use it.

IMG_1491

The Hardware

What I came up with was a pelican case containing a National Instruments CompactDAQ system housing several high-speed analog input cards. I generated a BOM (including 5000 ft of instrumentation cable!) for sourcing to procure while I worked on the software, so that by the time the hardware came in, all I had to do was assemble everything, load on the software, and bring the system over to the GE facility.

With so many sensors and wires, it was essential to have good labeling in place so that there was no doubt of which port a sensor connected to. Thus, the ports and both ends of each wire were numbered, and the port numbers were also present in the software to be matched to each sensor’s serial number.

The Software

The software I wrote to collect the data was written in LabVIEW. It allowed for simple entry of the necessary calibration information for each sensor, and the user could save and load sensor data to a file. Since many of the technicians were unfamiliar with the concepts of directories and file paths, these were automatically generated based on a few data fields the technician would fill out. There was also a convenient button that would open up the latest data file for verification before moving on to the next test.

Stack DAQ Screenshot

With so many sensors recording at high speed, it was essential to buffer the data to avoid losing any. Thus, I used the concept of queuing the data and reading from this queue when writing to a file.

Since many different technicians would be using the system, I made and released a guide to get up and running with the DAQ hardware and software:

Stack DAQ Guide

System in Action

IMG_1479

Above is a photo of the system in action. The large piece of equipment in the background is the BOP, with dozens of pressure sensors attached at various key points.

Overall, the system was a great success, and the engineers were happy to get this type of data for the first time! Here is some feedback that I got from one of the engineers:

“Jeremy, Thanks for all of your hard work getting us set up to test the stacks. With your help we were able to use a lot of new technology to get data that we have never had before in this part of our business. Thanks for being so willing to help and deal with all of the setbacks we had!”

Family Day Projects

Once a year the GE Oil & Gas facility has a family day, and the ATO Lab prides itself on putting on the best show possible. These are some of the projects I made for family day over the years.

Bicycle Pump Race

Bike Race Photo

This was my first-ever LabVIEW automation project. Two players compete to inflate their bicycle tire to the target pressure in the shortest time. For each tire, I plumbed up a manifold with a pressure sensor, solenoid valve, and bicycle pump. Until the countdown starts, the solenoid valve bleeds pressure to avoid any cheating. Once the race starts, the valve closes and the players can inflate their tires. Once one of the tires reaches the goal pressure, a winner is announced and the solenoid valves open to bleed pressure and make ready for the next pair of challengers.

LabVIEW Pong

The classic game pong re-imagined with LabVIEW! Based off the LabVIEW Simple PONG 2 player game in the NI community pages. I modified the code to take in an integer as the pong paddle’s position, and then I wired up a couple of laser distance sensors to provide the player’s location. We flipped a projector 90° to face the floor, and I modified the interface to be white on black with square “pixels” for a retro experience.

Ultrasonic Instrument

IMG_6188 Crop

Taking inspiration from my Theremax project, this simple device takes in a distance reading from an industrial ultrasonic sensor and generates a tone from a speaker and lights up a ping pong ball using an RGB LED.

Mini Flow Loop

IMG_0228

I wired and set up the proportional valve, flow rate sensor, pressure sensor, and temperature sensor on this small-scale flowloop and wrote the software to control it. Its purpose is to show how flow rate and flow restriction influence pressure and temperature in flow.

Diverter Seal Test System

This was my very first automated test that I was responsible for. I learned a lot of lessons along the way that have stuck with me for every project since.

The Goal

This test involved using a hydro-pump to pressurize two elastomeric seals. The customer wanted to pressurize the seals, hold pressure, bleed pressure, and then repeat until failure. Every 500 cycles, the seals needed to be leak tested by performing an extended hold and checking for pressure drop. If a seal failed, testing on it should cease, but the other seal should continue to be cycled until failure.

The Hardware

This was the first time I designed both the plumbing and electrical controls for a test.

Since each seal needed to be tested independently, each one had its own air-actuated isolation valve. On the pressure supply side, an air-driven hydro pump was turned on/off with a solenoid valve that supplied shop air. The supply side also had an accumulator which would be pumped up during hold periods, significantly reducing cycle time by increasing the speed at which the seals would fill with water. A common bleed valve was used to depressurize the seals between cycles.

Diverter Test Setup 1

The electrical board housed a cRIO with the necessary analog input and digital output cards. To control the air-actuated valves, a manifold with solenoid valves was used to convert electrical signals to valve actuation.

The Software

The interface had a simple plumbing schematic as well as manual and automatic controls. If a seal failure was detected, a large red indicator would light and the seal would be automatically isolated for the remainder of testing.

iPhone Dump 6.1.14 5149

Performance and Lessons Learned

The system worked well at first, detecting seal failure by checking for a percentage of pressure drop during the hold periods. However, a failure mode crept up on me that I didn’t account for: if the seal failed during pump-up, it would leak and never build enough pressure to move to the next test step. Thus, one day when we arrived to the lab, there was water all over the floor since the pump just kept on trying!

From that day forward, all automated system test steps included some sort of time-out to ensure the system stops the test if a condition is not met within a reasonable amount of time.

Brinell Hardness Greenbelt Project

The Problem

Brinell hardness measurement is a rough measure of the material properties of a sample. It involves using a hard ball to indent the material being tested, and then measuring the size of the indentation. The larger the indentation, the softer the material is since the ball was able to penetrate deeper. Sounds pretty simple, right?

This process actually has many variables that can affect the end result.

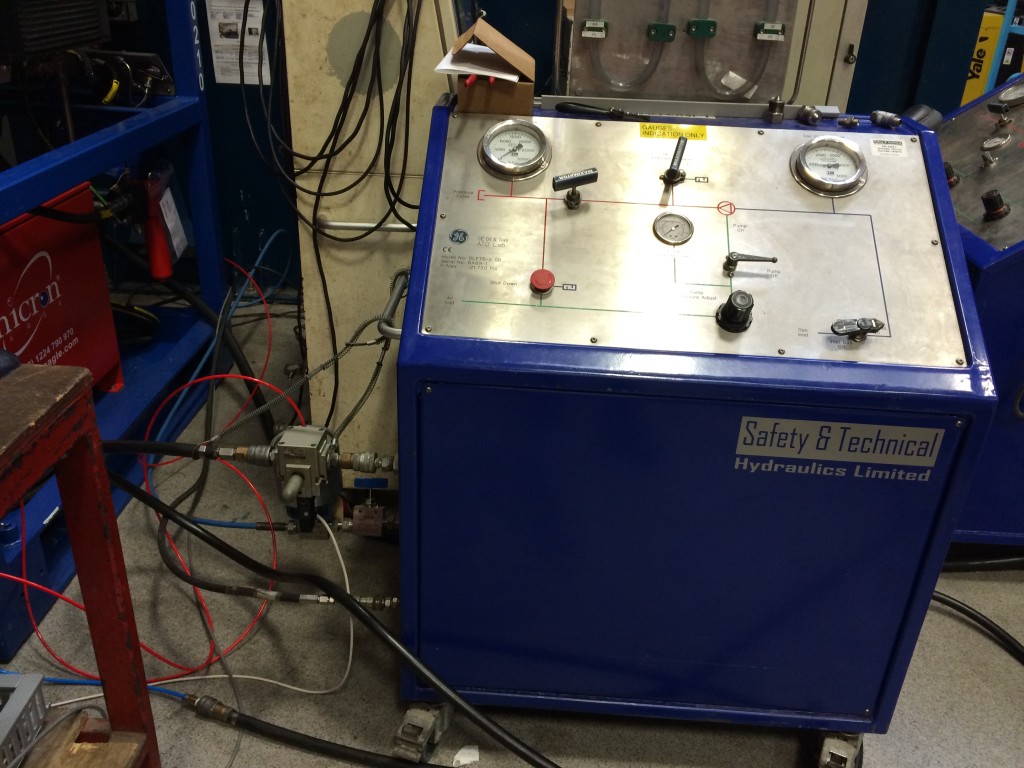
The indentation can be performed using several different tools including a stationary air-driven press or a hand-pumped device that is clamped onto the item being tested.

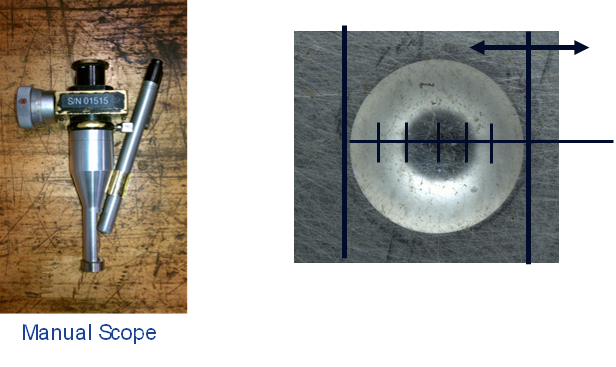
When reading the indentation, many different methods can be used. The cheapest method uses a handheld microscope-like device with two vertical lines. The user lines up one of these lines with the edge of the indentation and then twists a knob to bring the other line to the opposite side. By reading the amount incremented by the knob, the diameter of the punch can be measured. From there, the associated hardness reading is looked up from a table. Obviously this method includes a lot of human factors such as vision, motion accuracy, and correctly interpreting the result.

Manual scope diagram

In contrast, there are automated systems available which will capture an image of the indentation and calculate the hardness reading with minimal human influence.

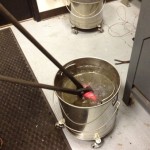
Before indenting a surface, it must be smoothed using a grinder. This can be either a sand or stone based grinding wheel, and the grinding force applied can vary between inspectors performing the operation. This can work-harden the surface, and this effect depends on the original hardness of the material.

Our task was to determine how some of these variables affect the final hardness reading and propose solutions where needed.

Hardness Reading

The main focus of the project was the reading of the hardness punch. Different manufacturing cells used different methods of measuring the indentation diameter, so we wanted to see what kinds of errors resulted from each method. We devised a double-blind gage R&R test that had the inspectors check pre-punched samples using three methods of measurement: the manual scope and two competing automated systems.

iPhone Dump 6.1.14 1727

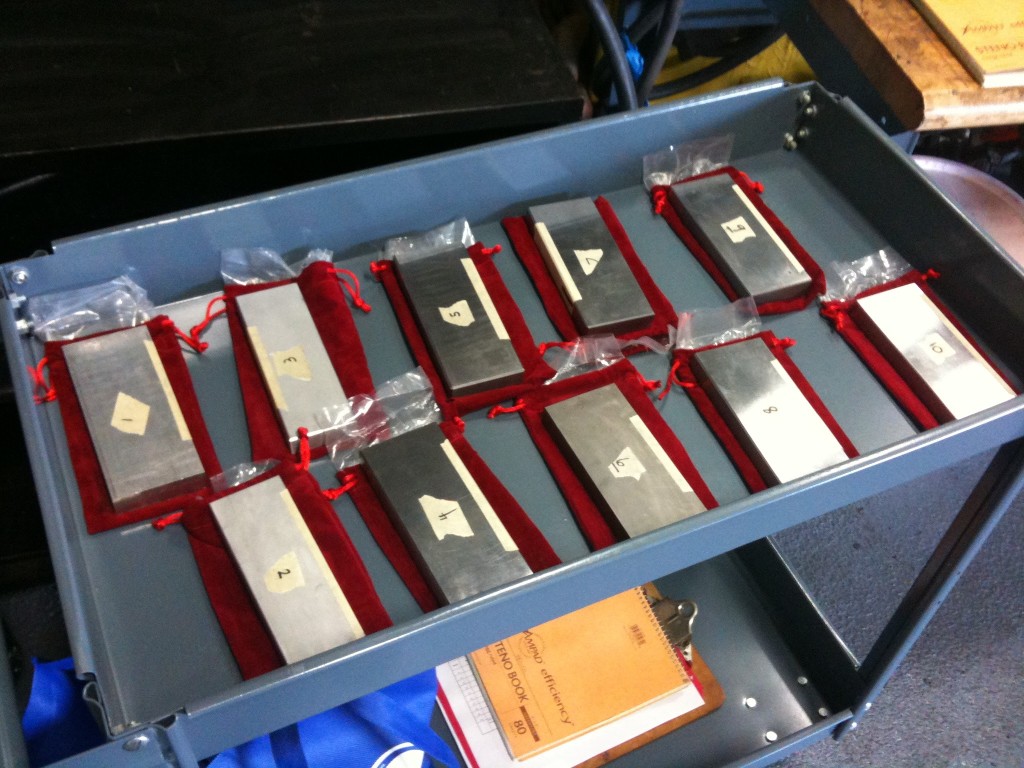
To obtain known hardness values, we used calibration blocks straight from the manufacturer. These blocks had 5 punches already made with hardness values disclosed for each. We covered up the hardness values, randomly assigned a number to each block, and then randomized the order in which the blocks would be handed to the inspectors. The inspectors would then test each punch and announce the result, which we would record. Each block was tested at least 3 times by each inspector with each punch measuring method.

Once all the data was gathered, we were able to remove the masking tape from each block, revealing its true hardness. We then compared the readings from the inspectors to the known values to compute the error in hardness reading using statistical analysis methods such as ANOVA.

Grinding

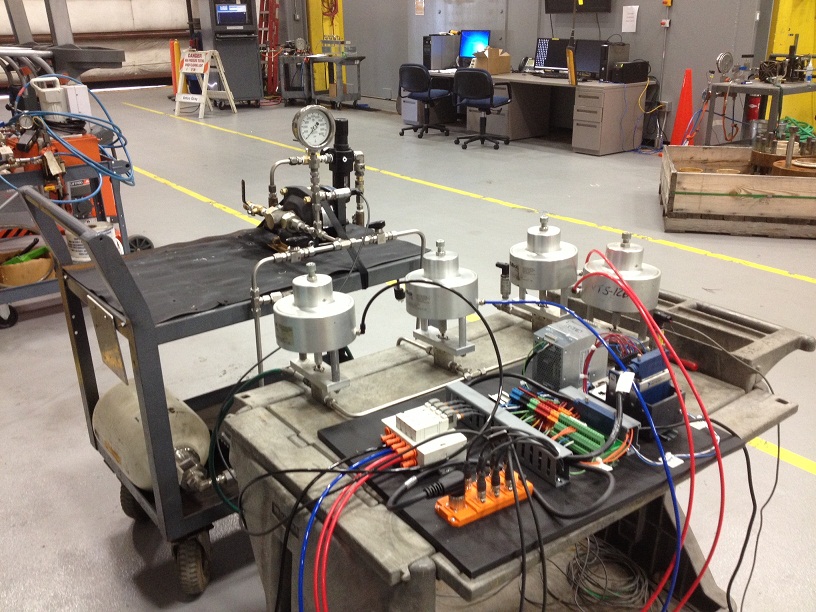
Another variable in the process is the way in which the surface is prepared. The two main kinds of grinding media are sand or stone, so these are the two that we tested. However, the user can exert any amount of force, which could potentially work harden the surface and skew the result.

Grinding hi res

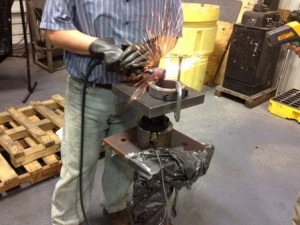
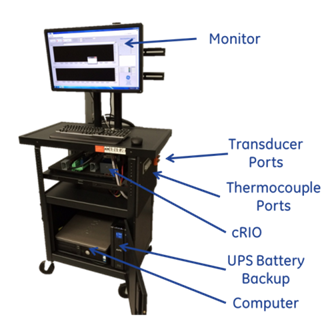
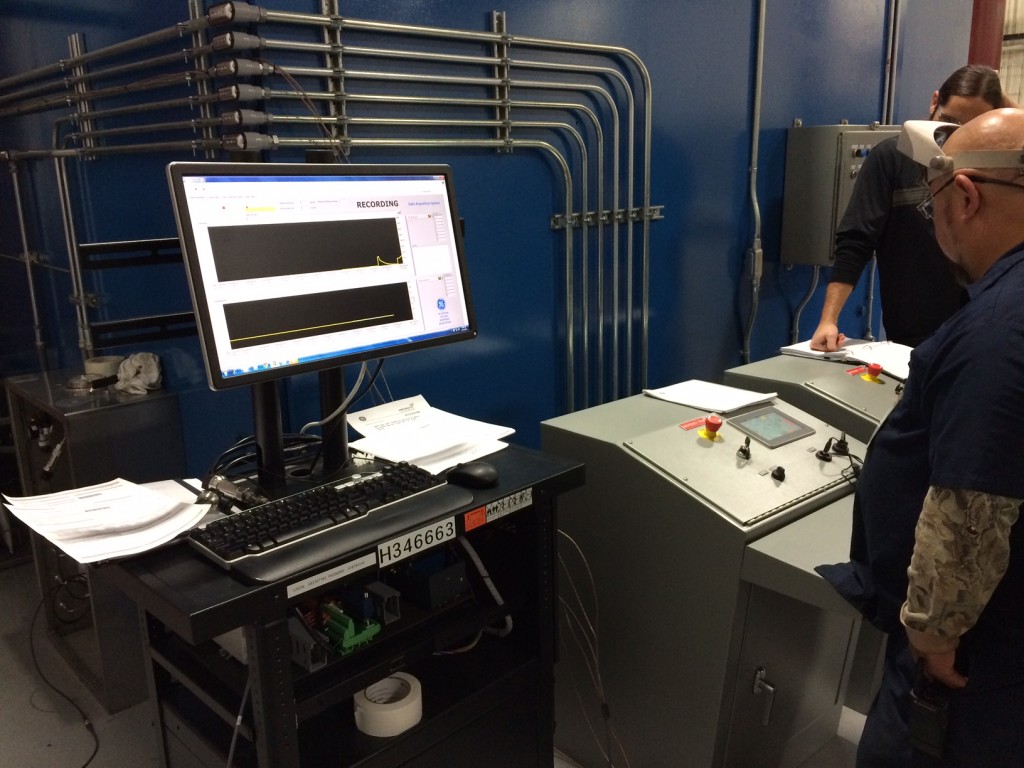
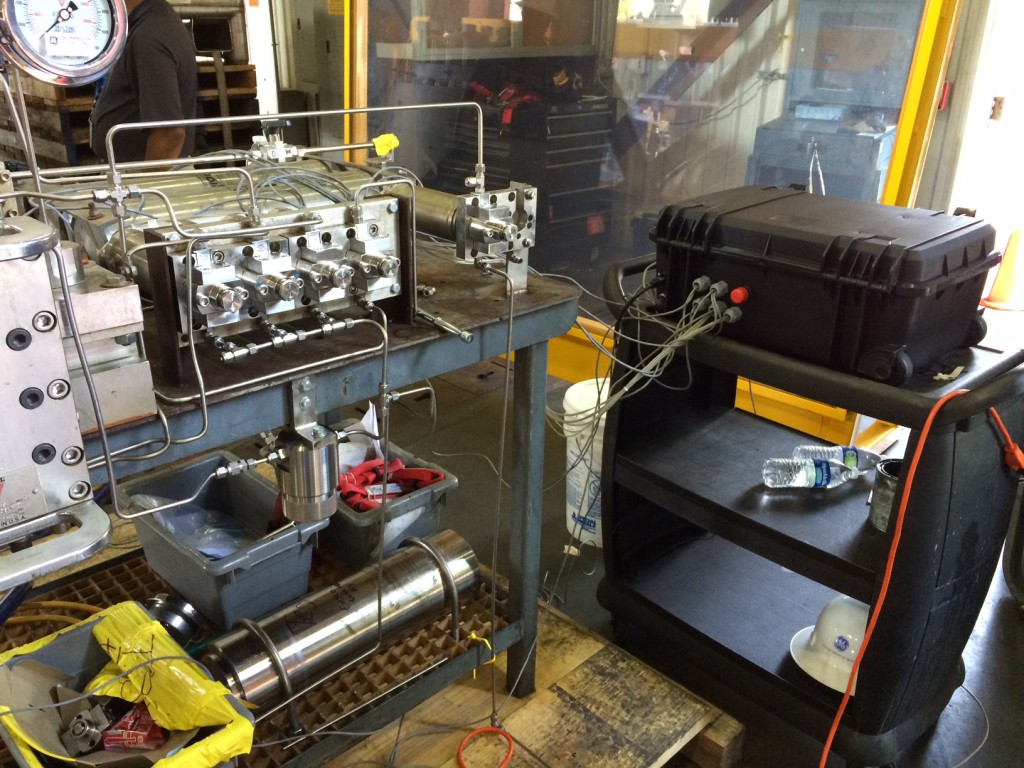
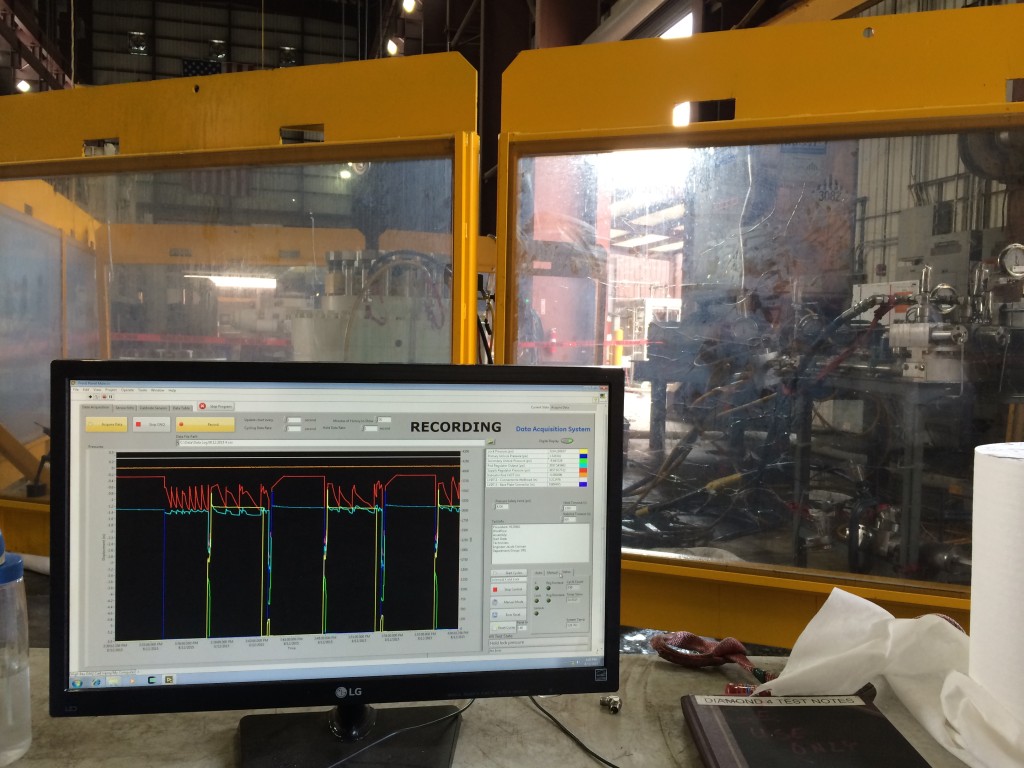
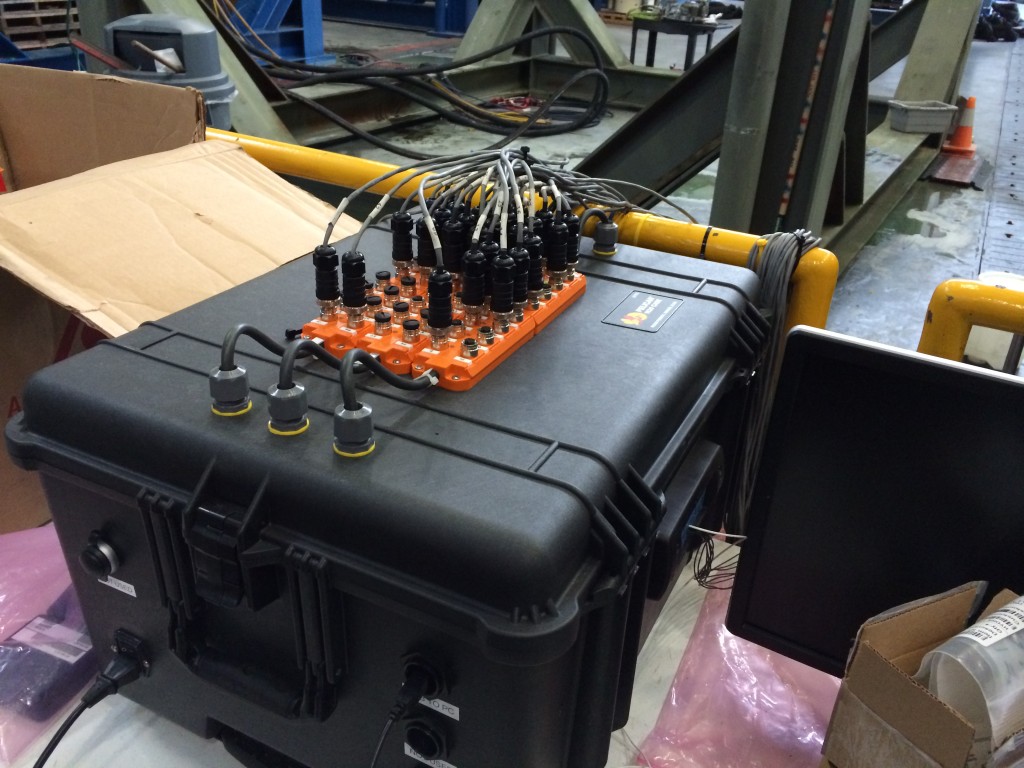
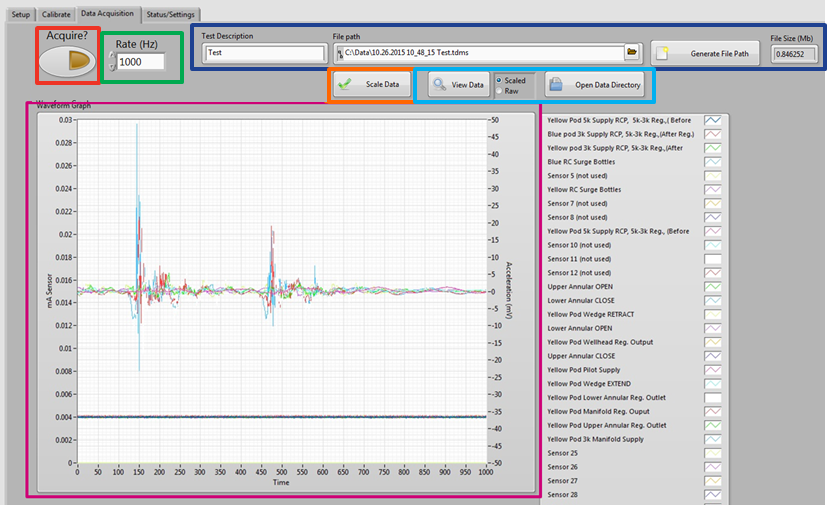
Thus, we devised a test fixture that would measure the load applied by the grinder using a load cell. I set up a simple data acquisition system using National Instruments hardware and LabVIEW, and we had the inspector grind softly, with moderate force, and with great force on various samples. We correlated the load applied to the resulting hardness reading to determine the effect (if any) of grinding force and media.

Heat Treating

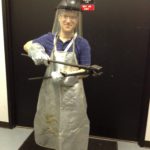
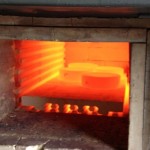
Another factor that applies to work hardening the surface is the initial strength of the material. To test this, we got to use an industrial furnace to heat treat samples to achieve material properties ranging from very soft to very hard.

These samples were used in the grinding experiment to see how much the hardness could be changed by the grinding process based on the initial hardness of the material.

Conclusion

While I cannot disclose the results of the study (it’s GE proprietary information), I can say that I learned a lot about material properties and hardness testing from this project. I was able to use many aspects of engineering to come up with experiments to test various aspects of the hardness testing process, and I got to interface with inspectors, cell leaders, shop floor managers, master black belts, material scientists, and even the vice president of engineering.

I was pleased to receive the following feedback from my manager:

“Thank you for the work you did on your Green Belt project. Your ability to work with various functions and groups enabled you to gather valuable data that led to critical changes to improve the hardness reading process. The experience and knowledge you gained during this process will benefit you as you grow in your career. Thank you for putting forth a tremendous effort!”

Valve Pressure Cycling System

The Task & Background

One of my goals in the ATO Lab was to help other GE Oil & Gas labs automate testing and acquire data using LabVIEW-based designs. One of our sister labs is in Aberdeen, Scotland, and they do similar tests to those done in Houston. One of their electrical technicians wanted to learn LabVIEW, so I was sent out there for some hands-on learning.

I like teaching and tutoring, and I have found that one of the best ways to learn how to do something is to find a project that requires the target subject and work through it. So we brainstormed some ideas for automated systems that would benefit the lab, and we decided to make a system that would automatically perform pressure cycles on a valve.

Each valve that is tested in the lab must undergo a certain number of body pressure cycles. These cycles involve pressurizing the bore of the valve with nitrogen gas, holding pressure, checking for pressure drop, and releasing pressure. Most valves undergo 50 or more of these cycles, so it is very beneficial to automate this tedious process.

The Process

This project was primarily a learning exercise, so I sat down with the technician and helped him set up a cRIO and get some basic I/O working with a relay module and an LVDT position sensor. I then helped him install our preferred revision control system software (TortoiseSVN) and we did a checkout and a commit. From there, with the technician at the keyboard, we created the valve cycling system LabVIEW software from scratch using a simple state machine architecture.

The Hardware

IMG_0661

We modified an existing pump system and added high pressure air-actuated valves for pump control, pressure supply, and bleed. We also added a pressure transducer to read the pressure inside the valve, which is crucial for automated control.

For the electrical controls, we used a cRIO with an analog input module, a relay module, and a digital input module. The relay module allowed for the control of solenoid valves which would supply air to the air-actuated valves.

These normally-closed solenoid valves obtained their power through a circuit that passed through an E-stop button. If this button is pressed, all the solenoid valves relieve pressure, causing their corresponding air-actuated valves to close and for the pump to stop. A digital input line from the E-stop informed the software if the E-stop had been pressed.

The Software

Over a two week period, we created a state machine in LabVIEW that would perform the various steps in the cycle and check for pressure drop, timeout, and a variety of other errors. After showing the technician the basic architecture, I had him figure out the various state transitions and error checks needed to make the system work.

Testing

We got the system up and running and tested it on one of the valves on the shop floor. You can see me next to the interface in the photo below. The screen shows a strip chart of the valve pressure as well as the valve cycling controls.

IMG_0658

Overall the project was a success! The system ran well, and the technician learned some LabVIEW and how to set up and troubleshoot a cRIO Real Time system. Below is a photo of a proud technician and his creation:

IMG_0660

Automated System Training

Arduino Training Sessions

While at the ATO lab, I wanted to share some of the knowledge I had acquired through my hobby projects. Many coworkers were interested in some of the projects I had been working on at home, and they wanted to know how they could do something similar. So I decided (with permission) to take a couple hours out of the week for hands-on Arduino training sessions.

IMG_20160412_161754

Starting at the most basic level of installing the software and running the blink sketch, I walked the class through topics such as:

  • Digital inputs and outputs
  • Reading from analog sensors
  • Scaling analog readings
  • Serial communication
  • Using PWM to control LED brightness
  • Installing external libraries
  • Reading from digital sensors
  • Outputting to a screen using the I2C protocol
  • If statements, for loops, while loops, functions

After two weeks of training, I had my students come up with a project using some of the parts I had. Here is what they came up with :

A bluetooth-controlled light

A bluetooth-controlled light

A stepper motor clock

A stepper motor clock

A badge access system

A badge access system

Automated plant watering

Automated plant watering

A parking sensor for the garage

A garage parking sensor


LabVIEW Real Time Training Rig

When you purchase a full license of the LabVIEW development system, you get access to self-paced online training. This is pretty great and allows for some good hands-on learning through coding exercises… that is until you reach the Real Time section which requires a specific set of hardware to actually perform the tasks.

IMG_0109

Thus, I made PR2D2, named after a standard temperature/pressure test we do in the lab (PR2) and everyone’s favorite droid. This board contains all the hardware needed to complete LabVIEW Real Time 1 and 2, enabling several developers in the lab to learn hands-on on their own schedule without the need to travel to a training center.

IMG_0006

I also made a label for it using our circuit board mill, with a Star Wars font and rebel alliance symbol for good measure.

Formal Training and Certifications

I have a LabVIEW Certified Developer status and have completed the following LabVIEW training modules:

  • LabVIEW Core 1
  • LabVIEW Core 2
  • LabVIEW Core 3
  • LabVIEW Real Time 1
  • LabVIEW Real Time 2

I am trained and certified to operate jib and gantry cranes up to 50 ton.

I have been trained and certified in Swagelok fittings and tube bending.

I have the radiation training certification necessary to operate an XRF tool.

I have had formal training and practice in GD&T.